 Figure 4: Interactive network visualization tool. A detail of
the network of retweets and mention for a hashtag commonly linked to “Ice
Bucket Challenge,” a popular Internet phenomenon from 2014. The size of a
node is proportional to its strength (weighted degree). The detail shows
the patterns of mention and information broadcasting occurring between
celebrities, as the viral challenge was taking off.
Figure 4: Interactive network visualization tool. A detail of
the network of retweets and mention for a hashtag commonly linked to “Ice
Bucket Challenge,” a popular Internet phenomenon from 2014. The size of a
node is proportional to its strength (weighted degree). The detail shows
the patterns of mention and information broadcasting occurring between
celebrities, as the viral challenge was taking off.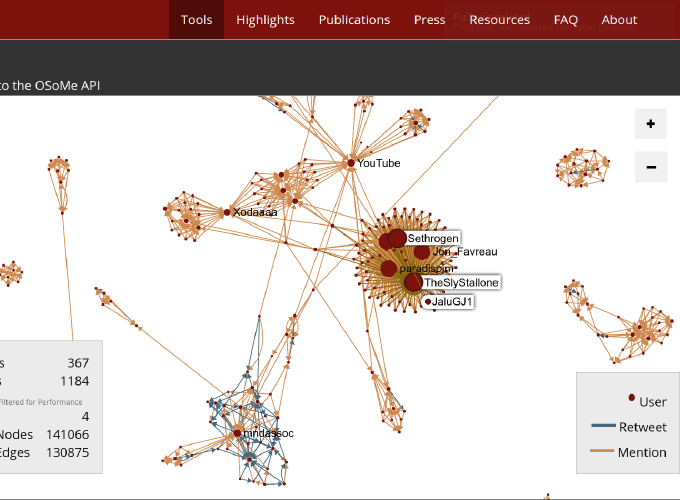
Abstract
The study of social phenomena is becoming increasingly reliant on big data from online social networks. Broad access to social media data, however, requires software development skills that not all researchers possess. Here we present the IUNI Observatory on Social Media, an open analytics platform designed to facilitate computational social science. The system leverages a historical, ongoing collection of over 70 billion public messages from Twitter. We illustrate a number of interactive open-source tools to retrieve, visualize, and analyze derived data from this collection. The Observatory, now available at osome.iuni.iu.edu, is the result of a large, six-year collaborative effort coordinated by the Indiana University Network Science Institute.